SPONSORED ARTICLES
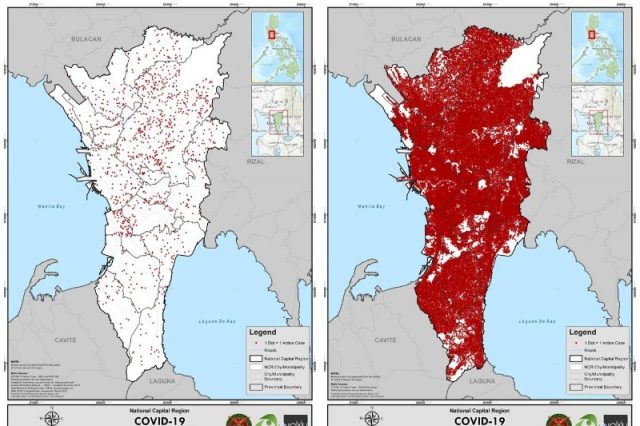
Experts released two maps that showed how active COVID-19 cases in the country have grown in over a month.
Data scientist Mahar Lagmay shared on January 18 two dot maps that juxtaposed data on active cases in the region last December 6 and January 15.
Lagmay thanked data analyst Peter Cayton, Jake Mendoza, Feye Andal, UP Resilience Institute, UP RI Youth Mappers, and the UP COVID-19 Pandemic Response Team for the maps.
“Before and after Omicron? Comparison of maps of active Covid-19 cases in Metro Manila on Dec. 6, 2021 and Jan. 15, 2022. #COVID19,” he said.
Before and after Omicron?
Comparison of maps of active Covid-19 cases in Metro Manila on Dec. 6, 2021 and Jan. 15, 2022.#COVID19Thanks to @PJACaytonPhD, Jake Mendoza, @dfeyeandal, @UPRIYouth, @UPResilience, and the #UPCOVID19PandemicResponseTeam. pic.twitter.com/BaFfvKs6Ad
— Mahar Lagmay (@nababaha) January 18, 2022
In the maps, each dot represents one active COVID-19 case.
Cayton previously clarified in a tweet that the dots were randomly distributed.
“Dots are randomly distributed within barangay of residence and does not indicate exact location,” he said.
The map on the left which depicted the active cases on Dec. 6, 2021 showed scattered red dots that are farther apart from one another all over the National Capital Region.
In the case bulletin for that day, the Department of Health recorded only 543 new COVID-19 infections, which brought the total number of confirmed cases to 2,835,154.
The number of active cases was also 0.5% or 13,548.
The positivity rate was also low at 1.7%
The map on the right which depicted the active cases on Jan. 15, 2022, on the other hand, showed the entire region nearly covered by red dots.
In the case bulletin for that day, DOH recorded an alarming 39,005 new COVID-19 infections, which brought the total confirmed cases to 3,168,379.
The country recently breached the three-million mark in the total number of COVID-19 cases.
The number of active COVID-19 cases is also 8.9% or 280,813.
The positivity rate had skyrocketed to 47.1%.
Meanwhile, Cayton shared three density maps of active cases in the entire country during the following dates:
- Delta surge: Sep. 5, 2021
- Close to lowest point: Dec. 26, 2021
- Current surge: Jan. 15, 2022
Philippine Density Maps from:
Delta Surge: Sep 5, 2021
Close to Lowest Point: Dec 26, 2021
Current Surge: Jan 15, 2022Thanks to the mappers and researchers facilitated by Jake Mendoza, @dfeyeandal, @UPRIYouth, @UPResilience, and the #UPCOVID19PandemicResponseTeam. pic.twitter.com/rbX83PDIcf
— Peter Cayton, the Stats Guy (@PJACaytonPhD) January 18, 2022
Last November, Lagmay and the other experts also released dot maps to juxtapose the NCR situation for that month and back in September 2021.
The maps that time showed how the country fared better November and December following the Delta spread last year.
READ: Juxtaposed: September and November 2021 maps of NCR’s active COVID-19 cases
How the public reacted
Some Twitter users were concerned about the increasing number of COVID-19 cases.
Some hoped that NCR would recover from Omicron surge soon.
“Nakakatakot pero ito ang totoong sitwasyon natin. NCR free COVID AGAIN. I hope for everyone’s fast recovery,” one Twitter user said.
One user quipped that the Philippines will still remain the same if it was a “zombie virus.”
“Had this been a zombie virus, either the government would’ve done better, or worse. Nothing in between,” the Twitter user said in jest.
Since New Year’s Eve or December 31, the number of new cases in the Philippines started to climb until it spiked in January.
It was also the same period when the country breached the 30,000 mark daily COVID-19 tally since the pandemic was declared.
DOH also confirmed the local community transmission of Omicron, a variant of COVID-19 which experts considered to be more transmissible than Delta, in Metro Manila.
READ: Philippines confirms community transmission of Omicron, cases hit record
Juxtaposed: December 2021 vs January 2022 maps of NCR’s active COVID-19 cases
Source: Filipino Trend Viral
0 Comments